Thanks to the use of “TransformGraph” we can collect data from many historical data into one table as opposed to BQL queries.
1. Add “TransformGraph” in Wire Sheet from the “seriesTransform” palette. Then open the Wire Sheet in just added “TransformGraph” and add on its Wire Sheet “HistorySource” from the same palette. The next two elements necessary to build the table will be “Composite” and “Terminal” also from this palette. The composite is located in the Nodes folder.
2. Double click on the first “HistorySource” and a pop up will appear. In “Source”, select the historical that you would like to put in the table. In addition, set “Interval”, the range of possible settings is:
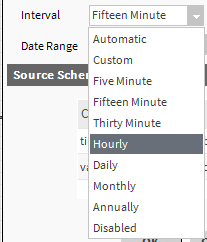
Figure 1. Interval options.
3. Next option, that you will need to set is “Data Range”, that is, the parameter determining from what period of time the data is saved:
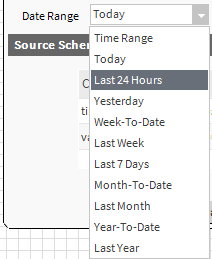
Figure 2. Data Range options.
After that it will look similiar to below:
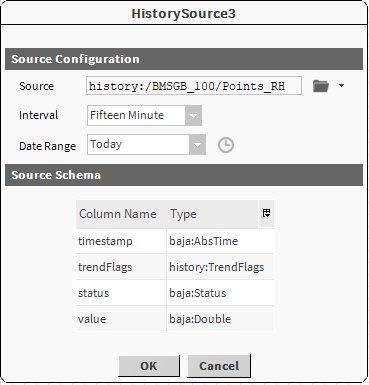
Figure 3. Configured HistorySource example.
Due to Niagara Workbench bug, click “OK” and re-open “HistorySource”. Near “Source Schema” will appear sign like “>>”. Click it and pop-up will appear. This pop-up is showing informations that historical data is sharing. Additionally it is possible to change “facets” and erase unwanted parts in table.
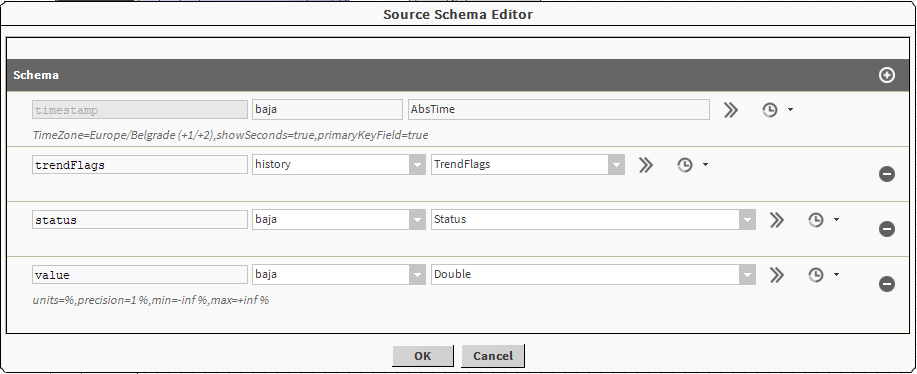
Figure 4. Source Schema Editor.
Set it like you want and click “OK”. Next “HistorySource” set using schema above. Connect “HistorySource” with “Composite” like on example below:
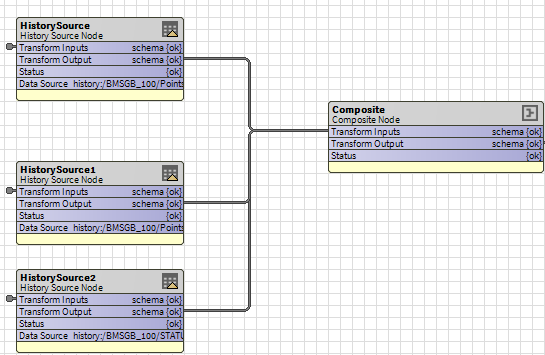
Figure 5. Connections on Wire Sheet.
Open “Composite” and pop-up will appear.
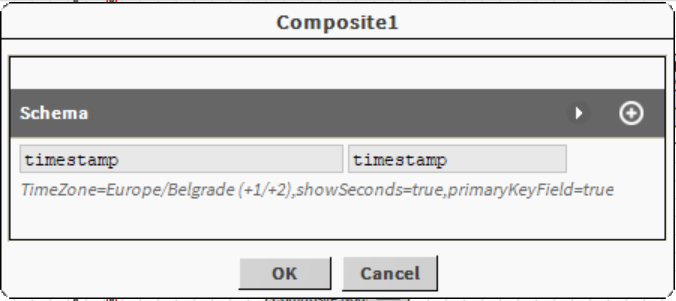
Figure 6. Composite editor.
In “Composite” to the table it is possible add all previously chosen elements in “HistorySource”. Add them using +, under “Timestamp” will appear new field, in which you can enter some text and an expandable menu in which are all available values. Additionally there is possibility to change “facets” in variable.
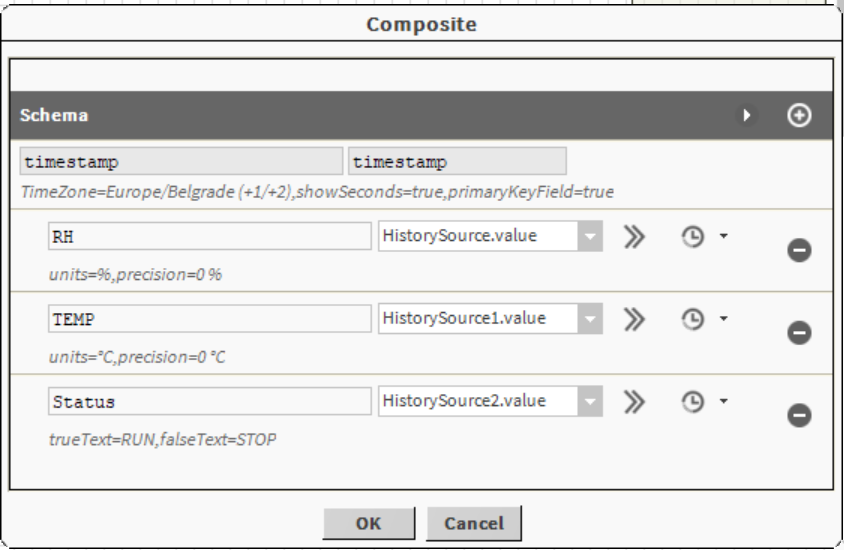
Figure 7. Configured Composite example.
Connect “Composite” to “Terminal” and double click on it. Set the display order in it using the arrows and confirm with OK. “TransformGraph” has been configured. You can preview the table appearance by right-clicking on “TransformGraph” and selecting “ResolveGraph”.
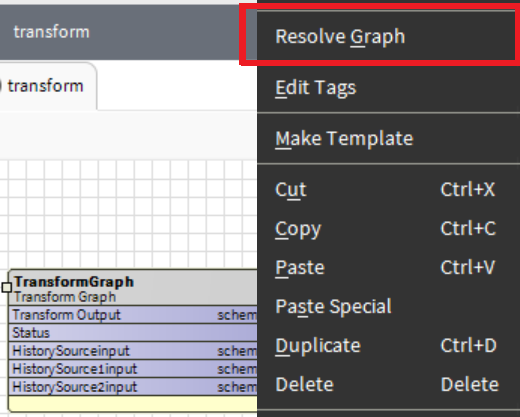
Figure 8. Resolve Graph.
There will appear pop-up that displays the path to the selected “TransformGraph”, and which parameters will be taken from it and displayed.
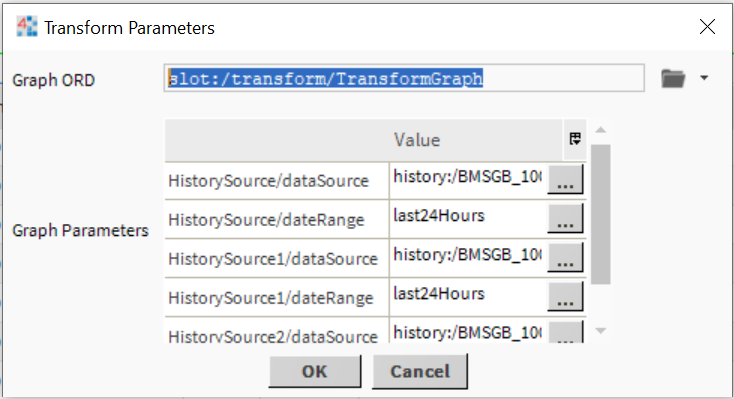
Figure 9. Informations about chosen Transform Graph.
After confirming that everything is correct, click “OK” and a table with historical data will appear in the selected “TransformGraph”.
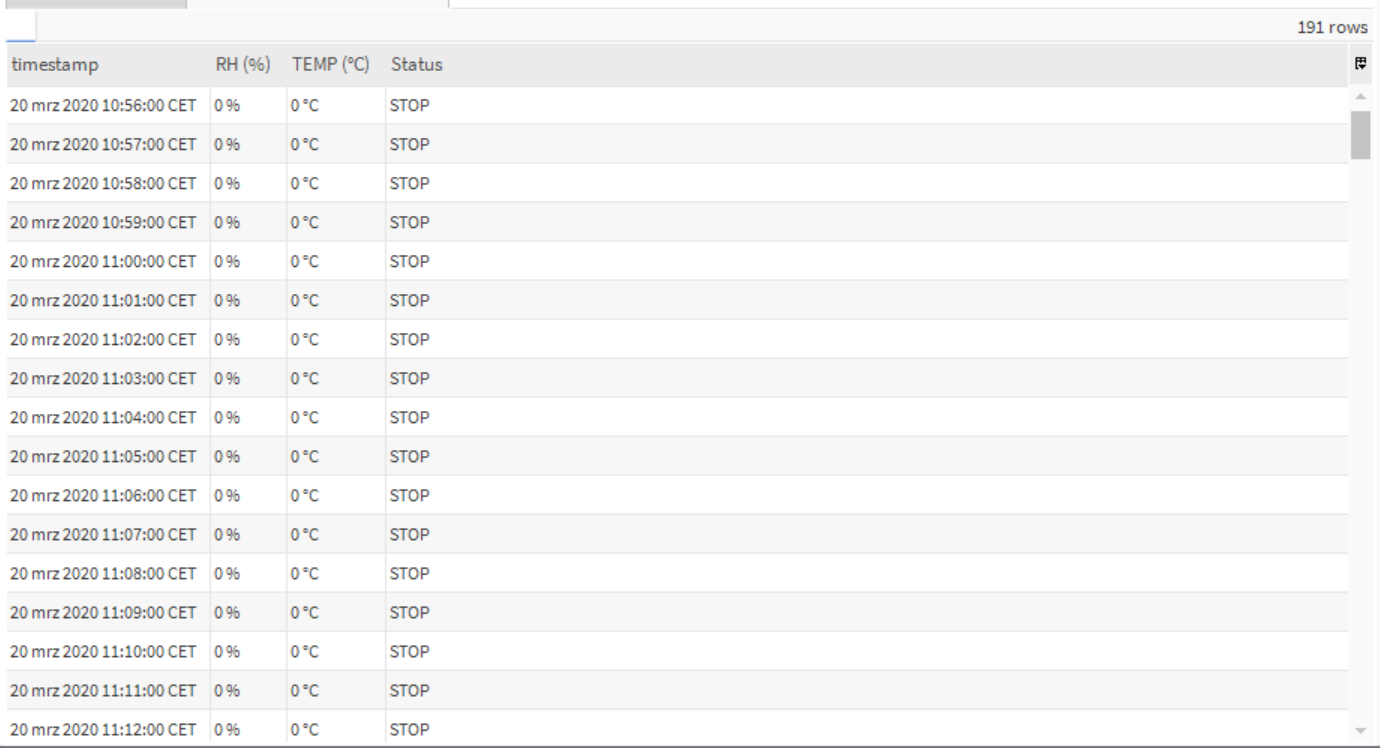
Figure 10. Data displayed in the form of a table.
