The article outlines how to create example reports in the Niagara system, how to export them to files, and send by e-mail. The article does not cover a basic configuration of reports, which is described in the Niagara - ReportService - Basic configuration article.
The article is based on an example prepared with several components containing meters readings with different values and ‘facets’ (units).
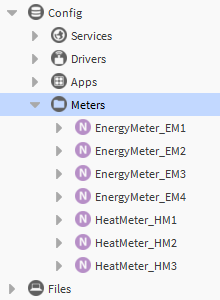
Figure 1. Example of application folders structure with electrical energy and heat meters readings
Before starting, it is required to open the ‘report’ module in the ‘Palette’ window.
1. Report in the ‘BqlGrid’ Component
In order to add the ‘BqlGrid’ component, drag&drop it to the ‘ReportService’. Added and displyed in the ‘AX Property Sheet’ view, the component has one slot available, ‘Query’, where it is required to enter the BQL request to read selected components. The request can be entered manually or created with the ‘BQL Query Builder’, however, the second method is less flexible.
Following are two examples of configuring a report showing only values of electrical energy meters (the first example can be created with the ‘BQL Query Builder’ but the second one has to be created manually).
-
station:|slot:/|bql:select displayName as 'Meters name', out.value as 'Read value' from control:NumericPoint where name like '%EnergyMeter%'
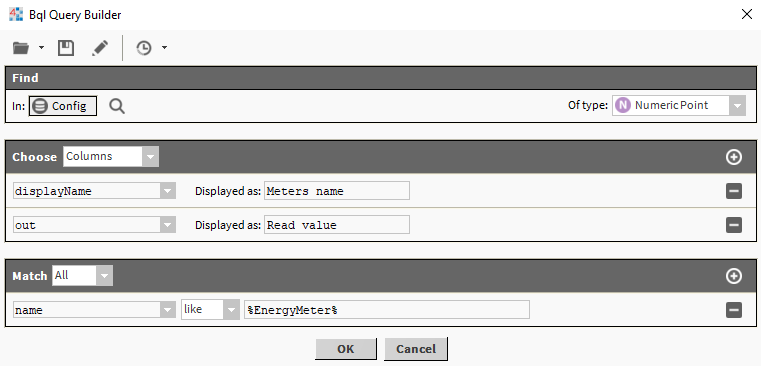
Figure 2. Generating a query in the ‘BQL Query Builder’ to display values of all electrical energy meters in the ‘BqlGrid’ component
-
station:|slot:/|bql:select displayName as 'Meters name', out.value as 'Read value' from control:NumericPoint where facets like '%kW-hr%'
In both cases, in the ‘AX Grid Table’ the following results are displayed:
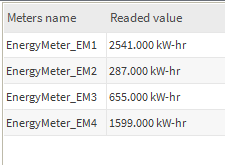
Figure 3. Results of the ‘BqlGrid’ for both BQL requests to show readings of the electrical energy meters - the ‘AX Grid Table’ view
2. Report in the PX View - Part of Visualization
To create the report displayed on one of visualizations views, two methods are available:
2.1. Using the ‘BqlGrid’ component as the ‘Workbench View’
The first method is to create the ‘BqlGrid' component, configure it as described in section 1, and drag&drop it to the PX view (editing mode). This makes the pop-up window appear; select the ‘Workbench View’ and ‘Grid Table’ or 'AX Grid Table from the list, confirm with OK.
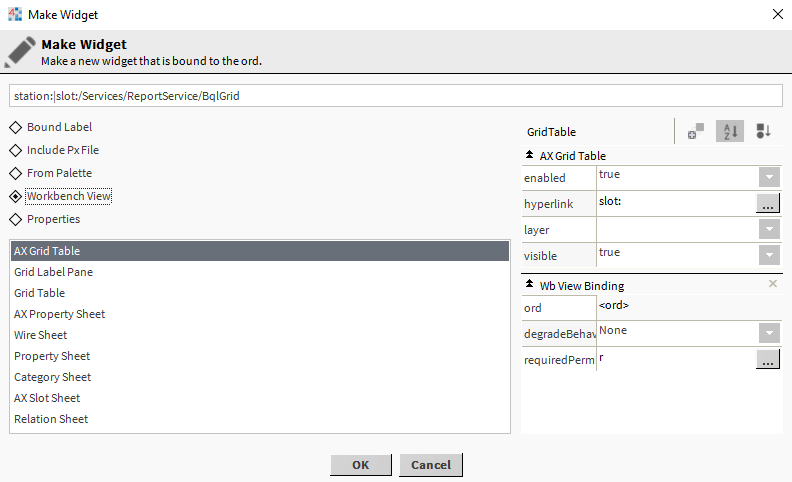
Figure 4. Adding the ‘BqlGrid’ to the PX as the ‘Workbench View’ → ‘AX Grid Table’
To illustrate, the ‘BqlGrid’ component has been created, which shows a list of all heat meters with the following query:
-
station:|slot:/|bql:select displayName as 'Meters name', out.value as 'Read value' from control:NumericPoint where name like '%HeatMeter%'

Figure 5. The ‘BqlGrid’ reading heat meters, added to the PX as the ‘Workbench View’
2.2. Using the ‘BoundTable’ Widget
To use the ‘BoundTable’ widget, open the ‘bajaui’ palette and expand the ‘Widgets’ folder. After adding it to the PX graphics, double-click it, and, in a new pop-up window ('Properties'), add the new binding, ‘bajaui:Table Binding’. Then, enter a proper ‘BQL’ query in the ‘ord’ slot.
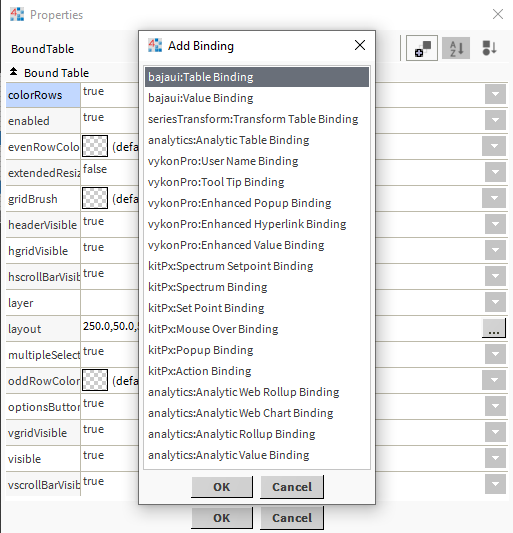
Figure 6. Configuration of the ‘BoundTable’ widget
To illustrate, the request has been created to display a list of heat meters:
-
station:|slot:/|bql:select displayName as 'Meters name', out.value as 'Read value', facets.units as 'Unit' from control:NumericPoint where name like '%HeatMeter%'
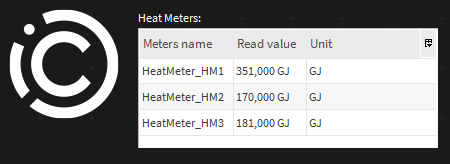
Figure 7. The ‘BoundTable’ widget reading heat meters, added to the PX
To compare the ‘BoundTable’ and ‘BqlGrid’: in the first method, the ‘out.value’ shows both a value and a unit, and in the second method, only a value, which is why, it is required to additionally display the ‘facets.units’ column.
3. Converting PX to PDF
In order to convert a report to a file (for example, PDF), first, it is required to create its template, so to open it in the PX view. Below is the example of the report for all meters:
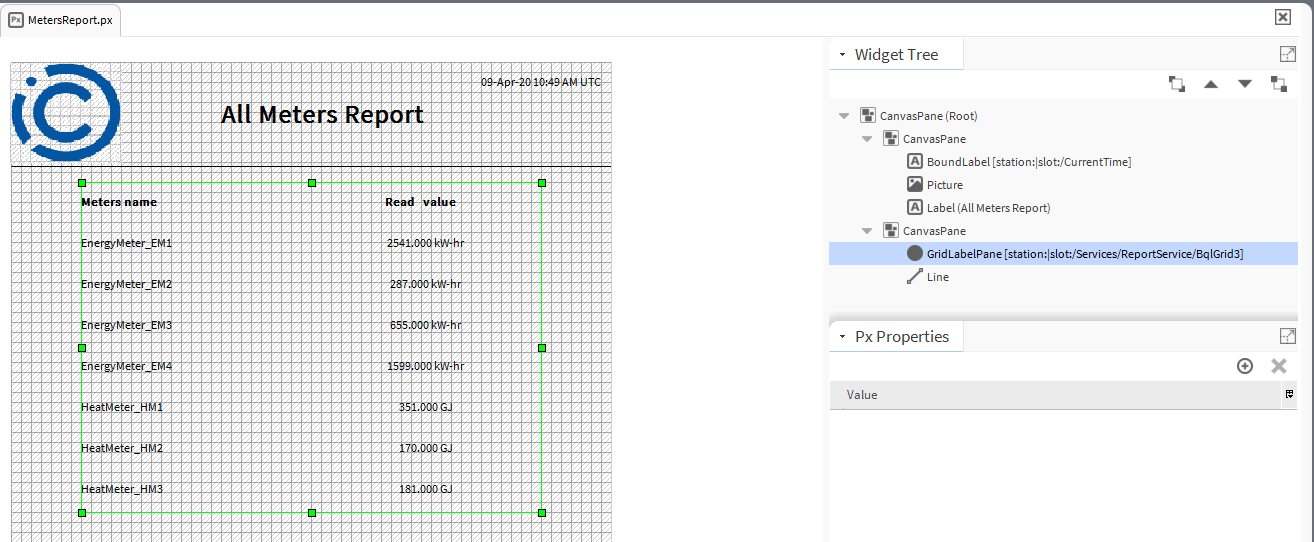
Figure 8. Example report for all meters ready to be exported to a file
Reading all meters (both electrical energy and heat) is done with the ‘BqlGrid’ component displayed as the ‘Workbench View’ → ‘Grid Label Pane’; the configuration of the ‘BqlGrid’ is described in section 1, and below is the used query:
-
station:|slot:/Meters|bql:select displayName as 'Meters name',out.value as 'Readed value' from control:NumericPoint where name like '%Meter%'
Next step is to use the ‘ExportSource’ component, which generates a file based on the PX source.
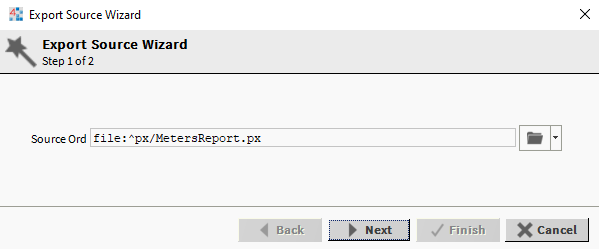
Obraz 9. Konfiguracja komponentu “ExportSource” - wskazanie źródłowego pliku PX.
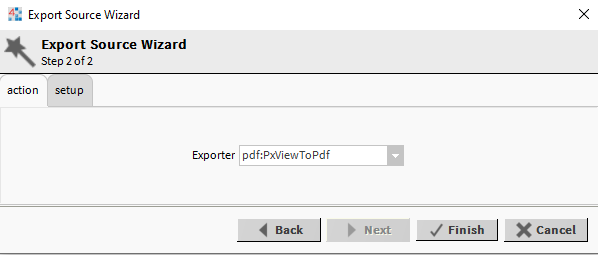
Figure 10. Configuration of the ‘ExportSource’ component - indicating a target PDF file
Creating a file is triggered by invoking the ‘Generate’ action or changing a status of the component linked to the ‘Generate’ slot (triggering is achieved both on the rising and falling edge). The ‘Export Source' component creates a file on the ‘Out’ slot so it is required to save it using one of the following methods.
WARNING: While creating a report, it is advised to avoid using special characters (for example, special characters of an alphabet), as the PXtoPDF converter in the Niagara system does not process them and will display them as unknown character).
3.1. Saving File in Local Station
Report files can be saved in the local station using the ‘FileRecipient’ component, which is available in the ‘report’ palette in the ‘Reporting’ folder. After adding this component, create a link from the ‘ExportSource’ (the ‘Out’ slot) to the ‘FileRecipient’ (the ‘Route’ slot). Configure the component, selecting a path (in the ‘Ord’ slot) to save the file, and decide whether to add a timestamp to the file’s name.
WARNING: In the ‘Ord’ slot of the ‘FileRecipient’ component, indicate the path to a folder, not to a file - the name of the saved file is based on the PX template name (optionally, with a timestamp).

Figure 11. Configuration of the ‘FileRecipient’ component - indicating the path to saving reports
If the reports are generated on the station in the ‘Supervisor’, their PDF files are located in the ‘C:\ProgramData\Niagara4.8\vykon\stations\My_station_name\shared’. Naturally, the path has to be completed with the folder configured in the ‘FileRecipient’ (in the described example, ‘Reports’), the Niagara version has to be compliant with the installed one, and the 'My_station_part” adjusted accordingly.
If the reports are generated in the controller (for example, iSMA-B-MAC36NL), the following methods can be used to share the report to the client (system service):
-
exposing files in the station configuration over the BACnet IP or FOX(s) protocols and downloading them to the PC (for example, with the ‘Supervisor’);
-
sending files by e-mail (described in section 3.2);
-
granting system service users access to station files (not recommended).
3.2. Sending Files by E-mail
Sending report files by e-mail is performed using the ‘EmailRecipient’ component, which is available in the ‘report’ palette in the ‘Reporting’ folder. After adding this component, create a link from the ‘ExportSource’ (the ‘Out’ slot) to the ‘EmailRecipient’ (the ‘Route’ slot).
WARNING: For proper operating of the functionality, the ‘EmailService’ and ‘OutgoingAccount’ components need to be configured.
Then, the ‘EmailRecipient’ component needs to be configured - indicate recipients, language, outgoing account (configured in the ‘EmailService’), message subject and contents. The PDF file is automatically attached to the e-mail.
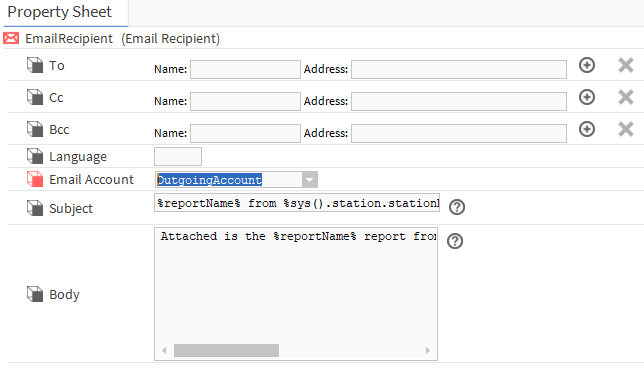
Figure 12. Configuration of the ‘EmailRecipient’ component
