The History Chart view is a view dedicated for a graphic presentation of historical data versus time, commonly called a graph. A graph is a line connecting subsequent samples, defined in a time interval and a range of values. The graph is located in the upper and main area of the view. Below there is a smaller area with a preview of the whole available range saved in the controller.
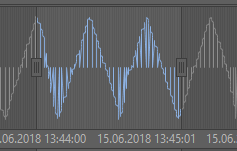
In the preview area there is a possibility of setting time limits against which the trend will be drawn in the main area above.

Setting time limits
After setting the time limits, the corresponding graph has been significantly narrowed and looks as shown on the figure below.

A graph after setting time limits
To analyze values on the History Chart move the mouse pointer over the registered samples–it shows their precise values. Additionally, the auxiliary lines show values on vertical and horizontal axes of the graph.
Clicking and holding the click allows to move the graph, while using the mouse wheel allows to zoom in/out the fragment of a graph. Each change of the graph’s range is updated in the preview area under the graph.
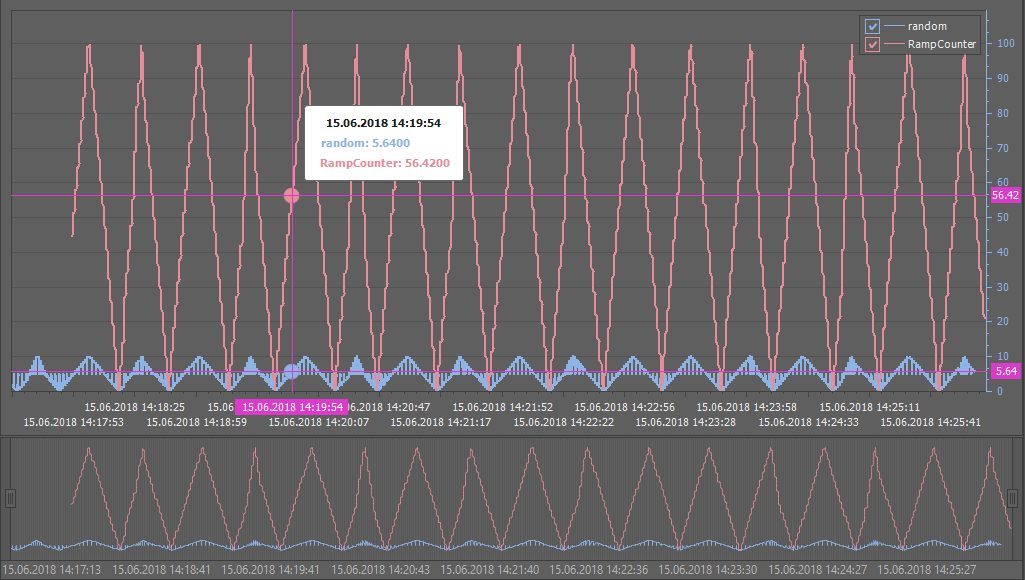
It is possible to add another trend to the observed chart and display them both simultaneously for analysis. To add another trend it needs to be dragged from the Workspace Tree, from under the db1 tree to the opened chart. The figure below shows a situation after adding the RampCounter trend.

Two trends displayed in the History Chart
After adding another trend, the upper graph and the preview area have been updated accordingly. As the two trends are displayed simultaneously, the auxiliary lines track and show registered samples for the two trends independently.
By default, after adding a second trend the value scale is common for both processes, but individual scales can be displayed for each of historical processes. This is allowed by the Enable/Disable Secondary Axes option in the context menu of the graph.

A context menu of a graph
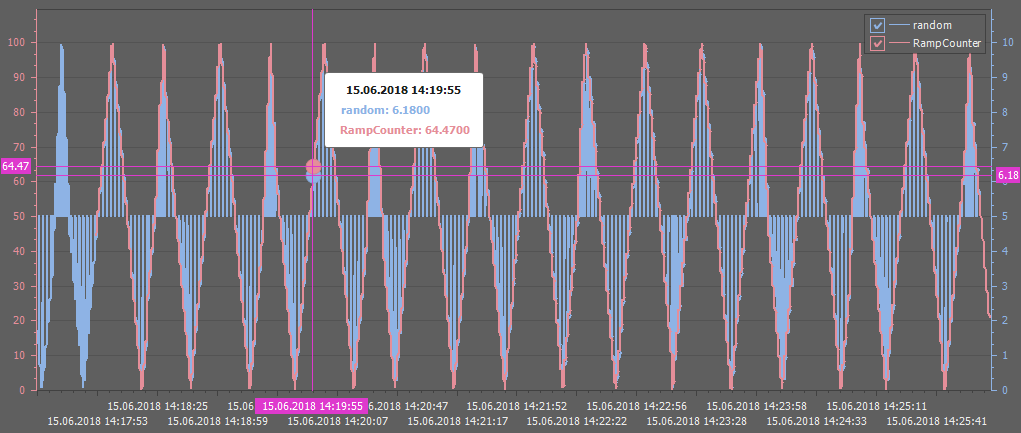
After initiating an individual oy axis, for each of the processes, trends are automatically rescaled to cover as big part of the graph area as possible (see the figure below).

A rescaled graph
A function of temporary hiding of historical trends is available when working with many trends. In order to temporarily hide the trend, deselect it on the key placed in the upper right corner of the graph.
The remaining options of the context menu allow to return to the default values of zoom with the Reset Zoom function, and to export or print the graph with the Export/Print function.
Initiating the Export/Print function starts a Preview application allowing to print and export the displayed graph. The offered export formats are .pdf, .html, .docx, .xlsx, .bmp, .gif, .jpeg, .png, .tiff, .emf, and .wmf. A detailed description of the function is available in section Exporting and Printing Program–Preview.
