The Configuration folder contains the Visualization_configurator.xlsm file, which is dedicated to configure the main view of the visualization. This file allows to customize prepared .html file and generate new .xml file to be sent to the SD card.
Configuration folder
Warning!
Please remember to save the web server configuration files locally, not in a network location (e.g.,OneDrive, Sharepoint, Google Drive, etc.); the web server will not operate if saved in a network location.
The Visualization_configurator.xls file is a main file for configuration of the visualization web server. It is constructed with separate tabs, which contain tables prepared to configure different functionalities of the visualization web server. Each tab includes a legend table, which explains functions of colored cells in tables:

Cells legend in the Visualization_configurator file
Also, each cell in tables has a Tip or Attention note assigned. These notes contain indications on a purpose of each field or restrictions of the fields edition.
Tips and Attention notes
Excel Sheets Description
Each of the configuration excel sheets is responsible for each editable container on the web page.
General
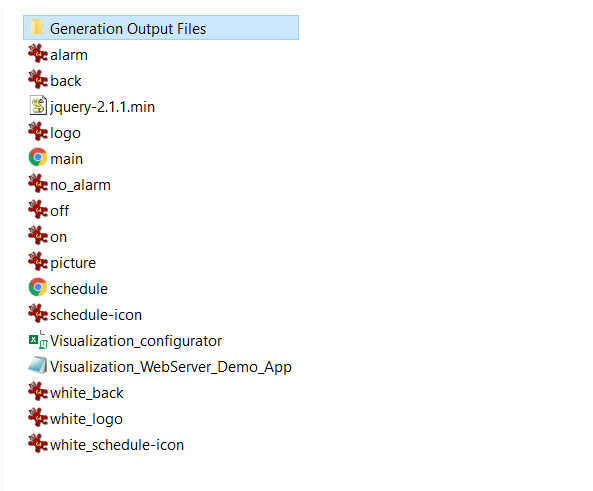
A general sheet defines all main information about the visualization page. Most importantly, it contains the Generate XML file button, which generates an. xml configuration file to be uploaded on the SD card. Using this option creates a Generation Output Files folder, which includes all files that have to be copied onto the SD card.
Warning!
In order to use the Generate XML File option, please remember to enable macros in the Excel application.
Warning!
While copying files to the SD card, please remember to copy files from inside the Generation Output Files folder, and paste them to the SD card directly, instead of copying the folder with its contents itself. Copying the folder and pasting it to the SD card will cause the visualization web server error. It is also not allowed to group files in folders.
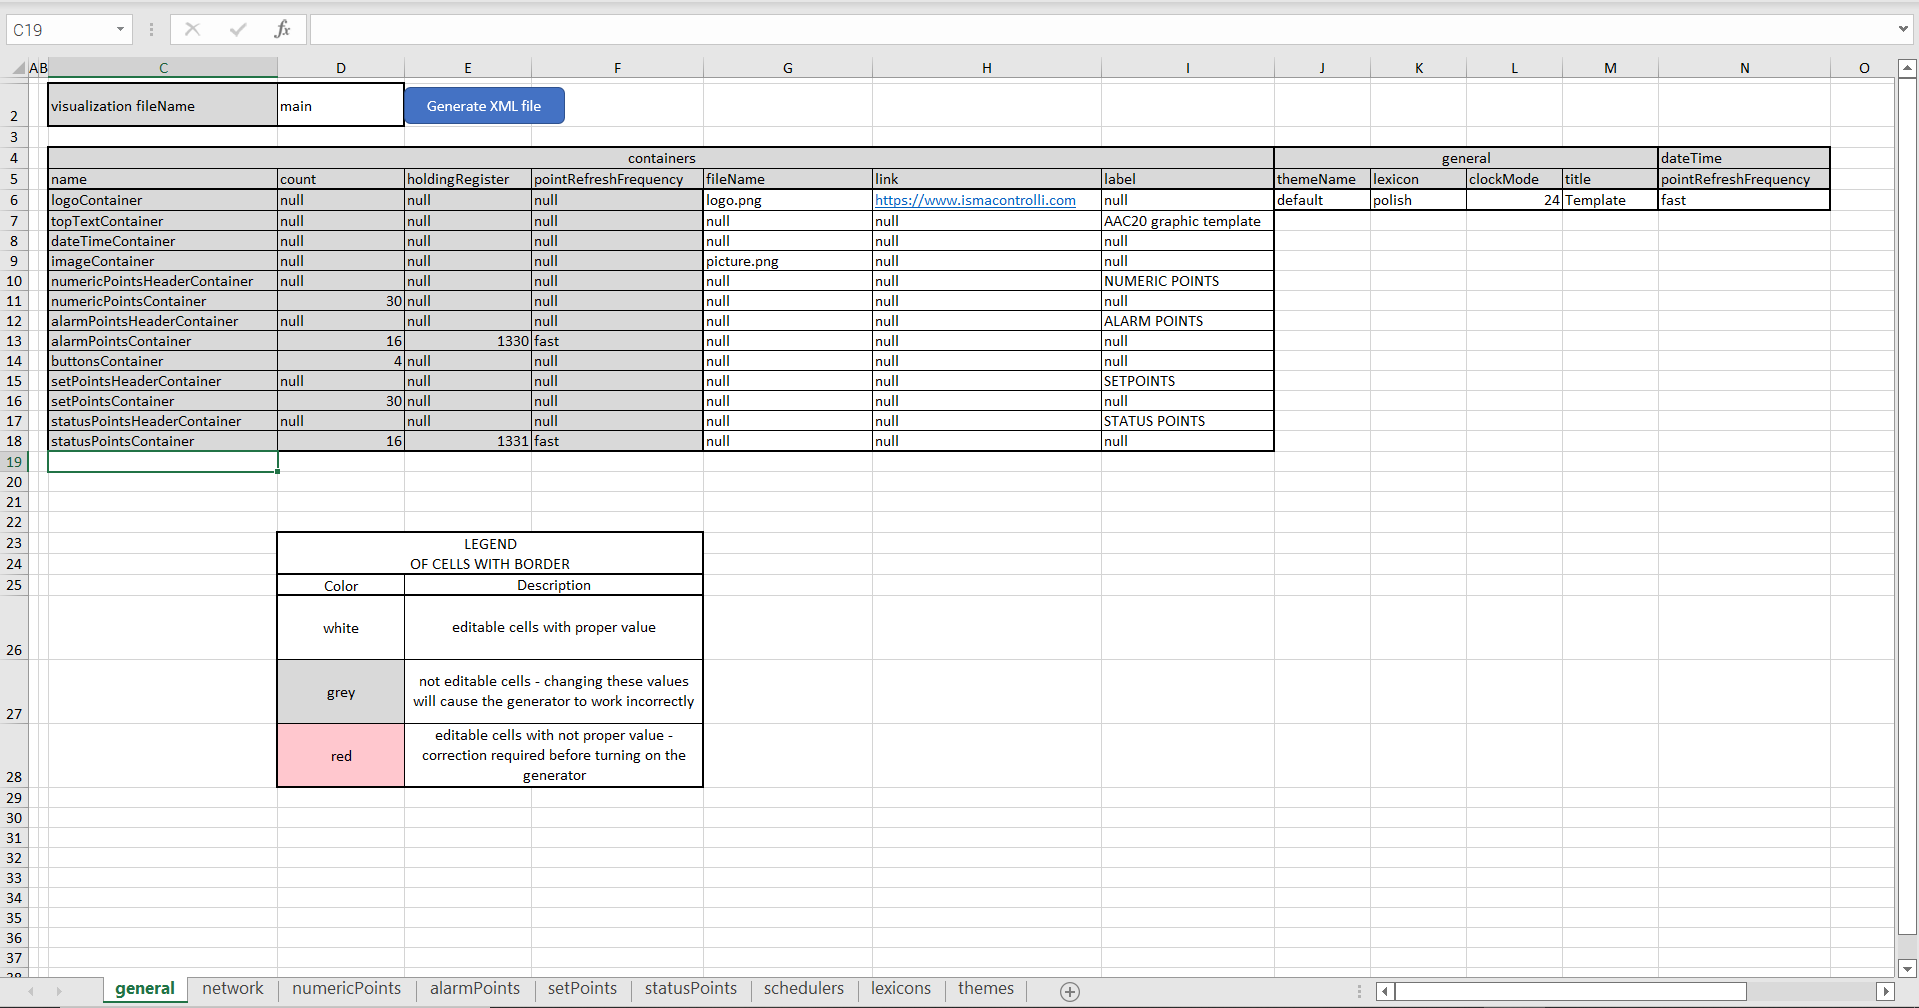
A general sheet
The general sheet contains the following parameters to edit:
-
fileName: identifies image files for logo and image containers (these files have to be located in the Generate Output Files folder);
-
link: allows to link a logo container image to a specific web location;
-
label: specifies header of container column's (top text container, numeric points header container, alarm points header container, setpoints header container, and status points header container)
Note: Please note that the above functionalities cannot be defined for fields where the null value is inserted. If such field is to be edited, the attention note is displayed:
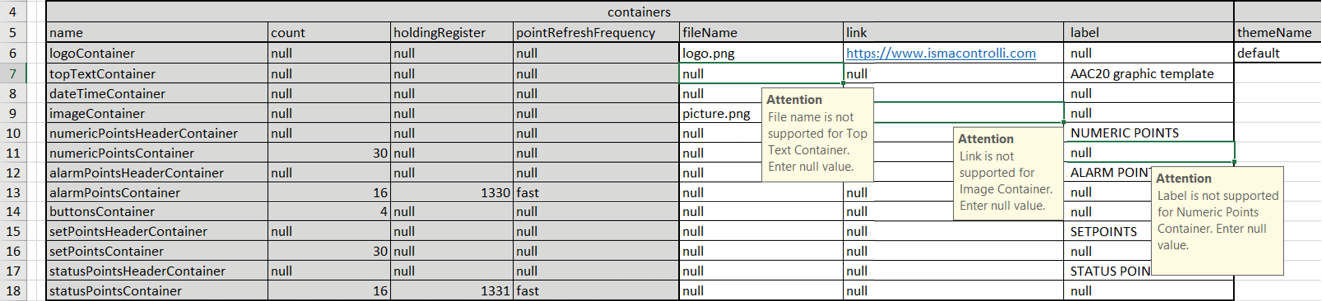
Attention note
In further columns, the following parameters can be configured:
-
themeName: defines a theme used for the web server (themes are configured in the themes tab);
-
lexicon: defines a language version used for the web server (translations are configured in the lexicons tab);
-
clockMode: defines a clock mode used for the web server;
-
title: defines a title displayed as a web page name on a browser's tab;
-
pointRefreshFrequency: sets a frequency of refreshing points values (frequencies are configured in the network tab).
Network
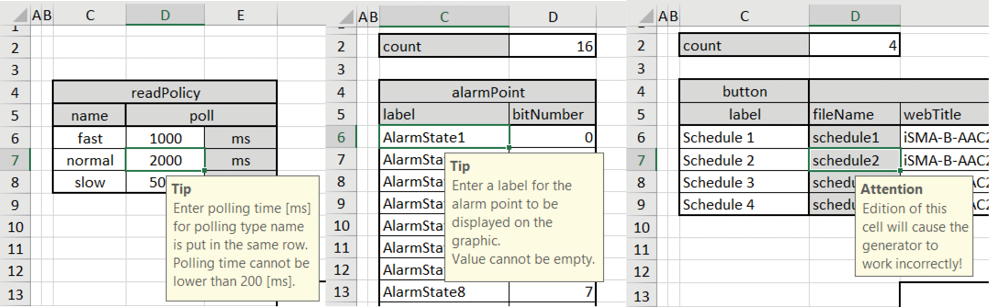
A network sheet defines values for read polling frequencies for each component visible on the visualization page;
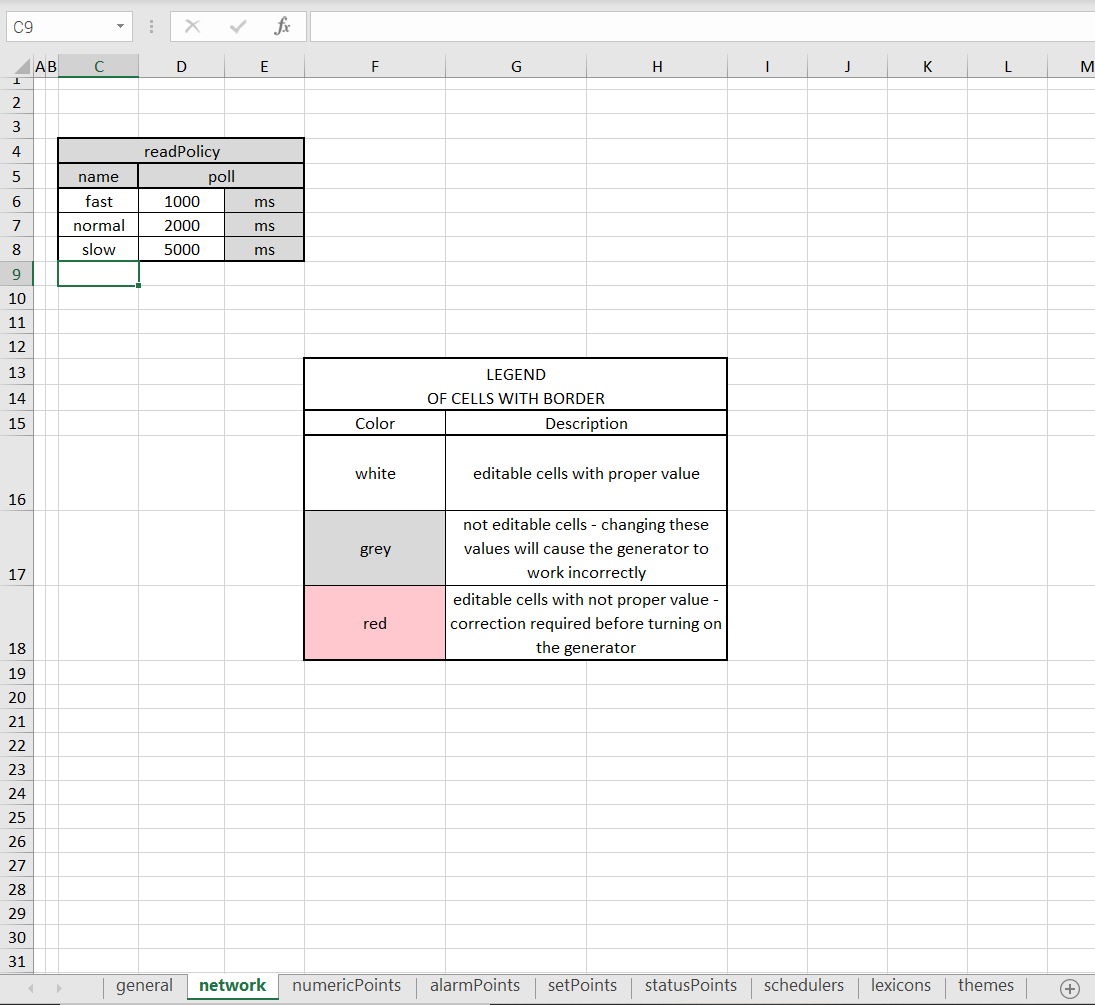
A network sheet
The default polling values are the following:
-
fast: 1000 ms;
-
normal: 2000 ms;
-
slow: 5000 ms.
The frequency, which is used to read values for points displayed in the visualization page, is determined in the general tab.
Note: It is not recommended to set the polling frequency faster than 1000 ms.
numericPoints
A numericPoints sheet lists all numeric points displayed on the visualization page.
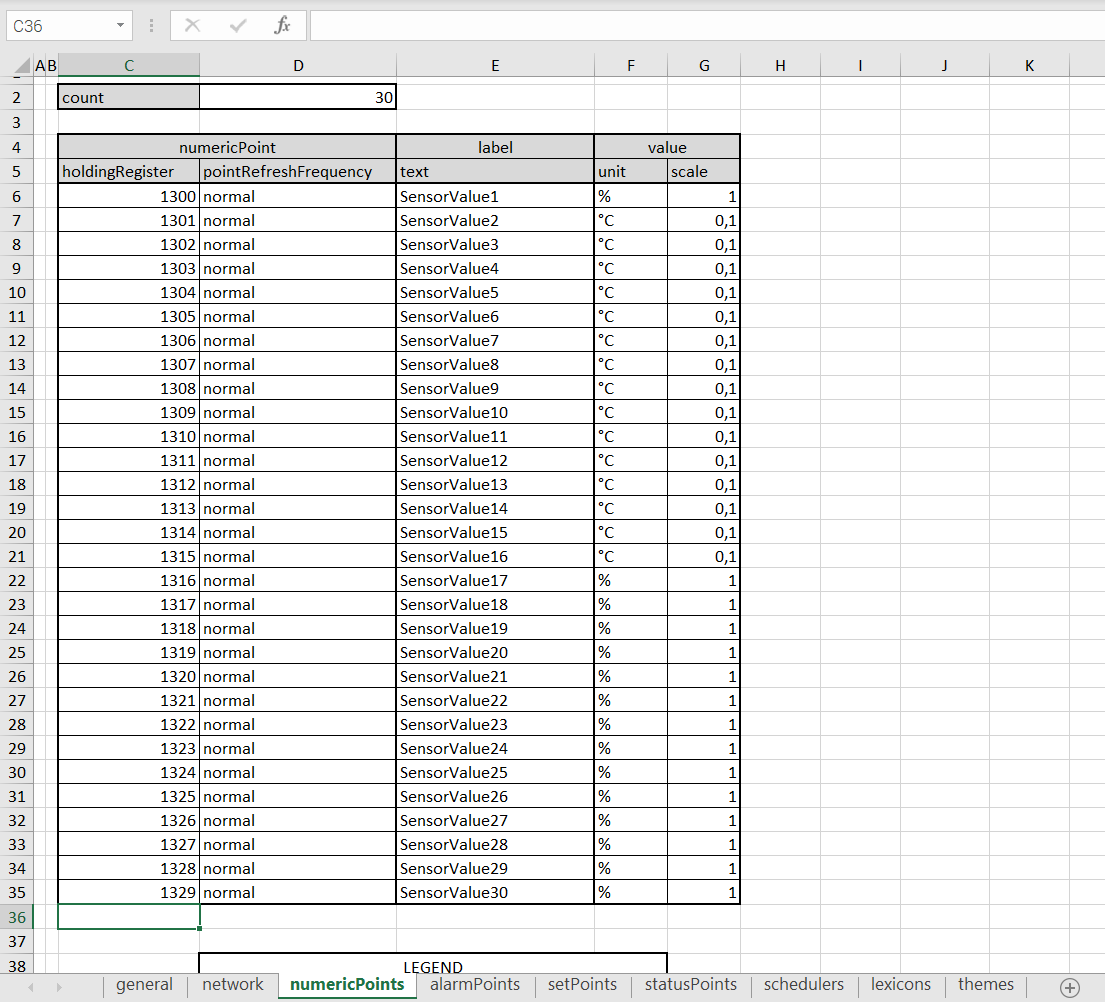
A numericPoints sheet
The maximum number of numeric points is set to 30. To set the number of visible numeric points, it is required to fill in the "count" cell. For each point, it is possible to set the following parameters:
-
Modbus holding register: defines the address of the Modbus holding register for the numeric point;
Note: It is not recommended to change the default addresses of holding registers due to their links to components in the Visualization_Webserer_Demo_App.sax file. Each change of addresses in the .xlsm file must be synchronized with the application in the iSMA Tool.
-
pointRefreshFrequency: choosing polling frequency selected from pre-defined values (fast, normal, slow);
-
label: text visible displayed on the main visualization page;
-
unit: unit visible displayed on the main visualization page;
-
scale: scale of the Modbus holding register for correct reading via Modbus protocol.
alarmPoints
An alarmPoints sheet lists the alarm points displayed on the visualization page.
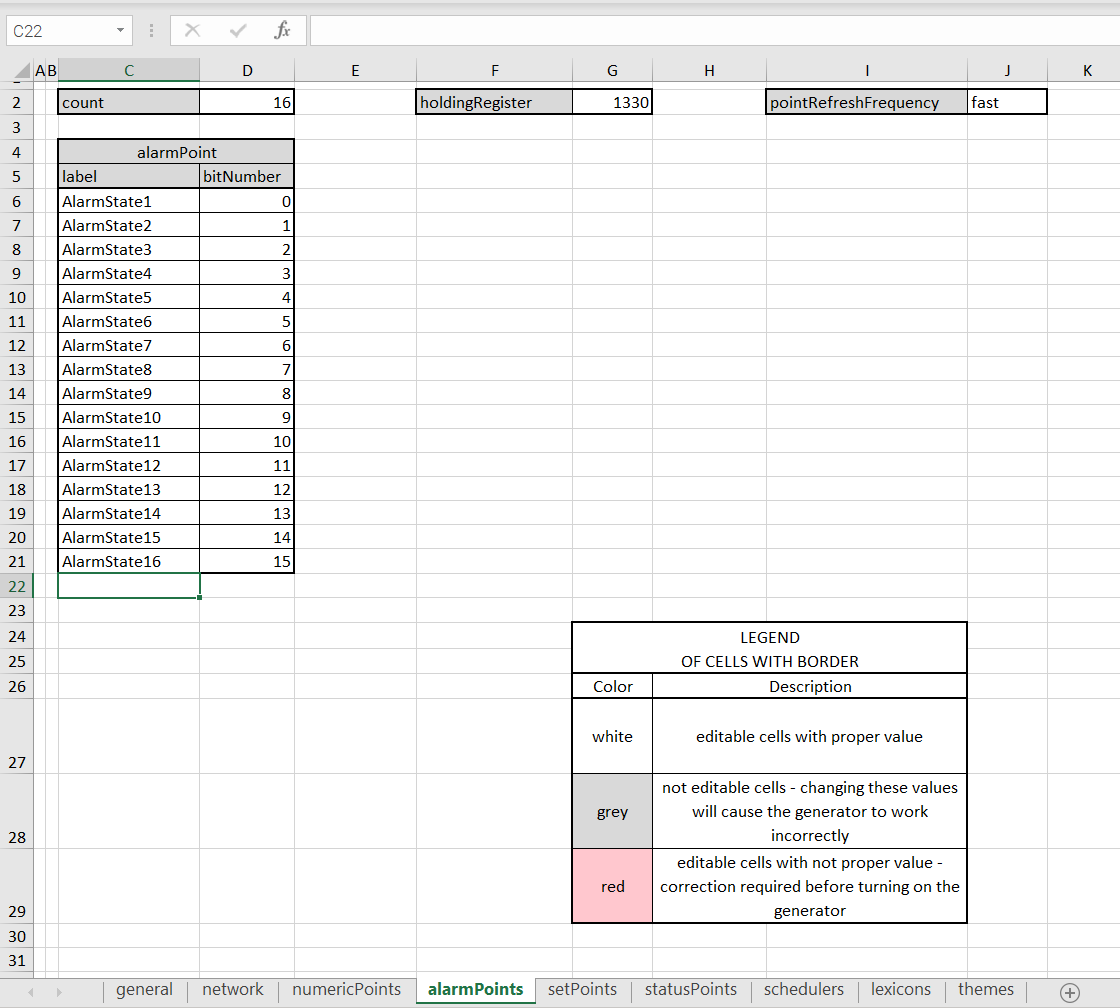
An alarmPoints sheet
The maximum number of alarm points is set to 16. To set the number of visible displayed number alarm points, fill the "count" cell. All alarm points use 1 holding register. Polling frequency can be set for reading points (fast, normal, slow).
For each point, it is possible to set the following parameters:
-
label: text visible displayed on the main visualization page;
-
bitNumber: defines a bit of a holding register responsible for each variable in a component.
setPoints
A setPoints sheet lists all setpoints displayed on the visualization page.
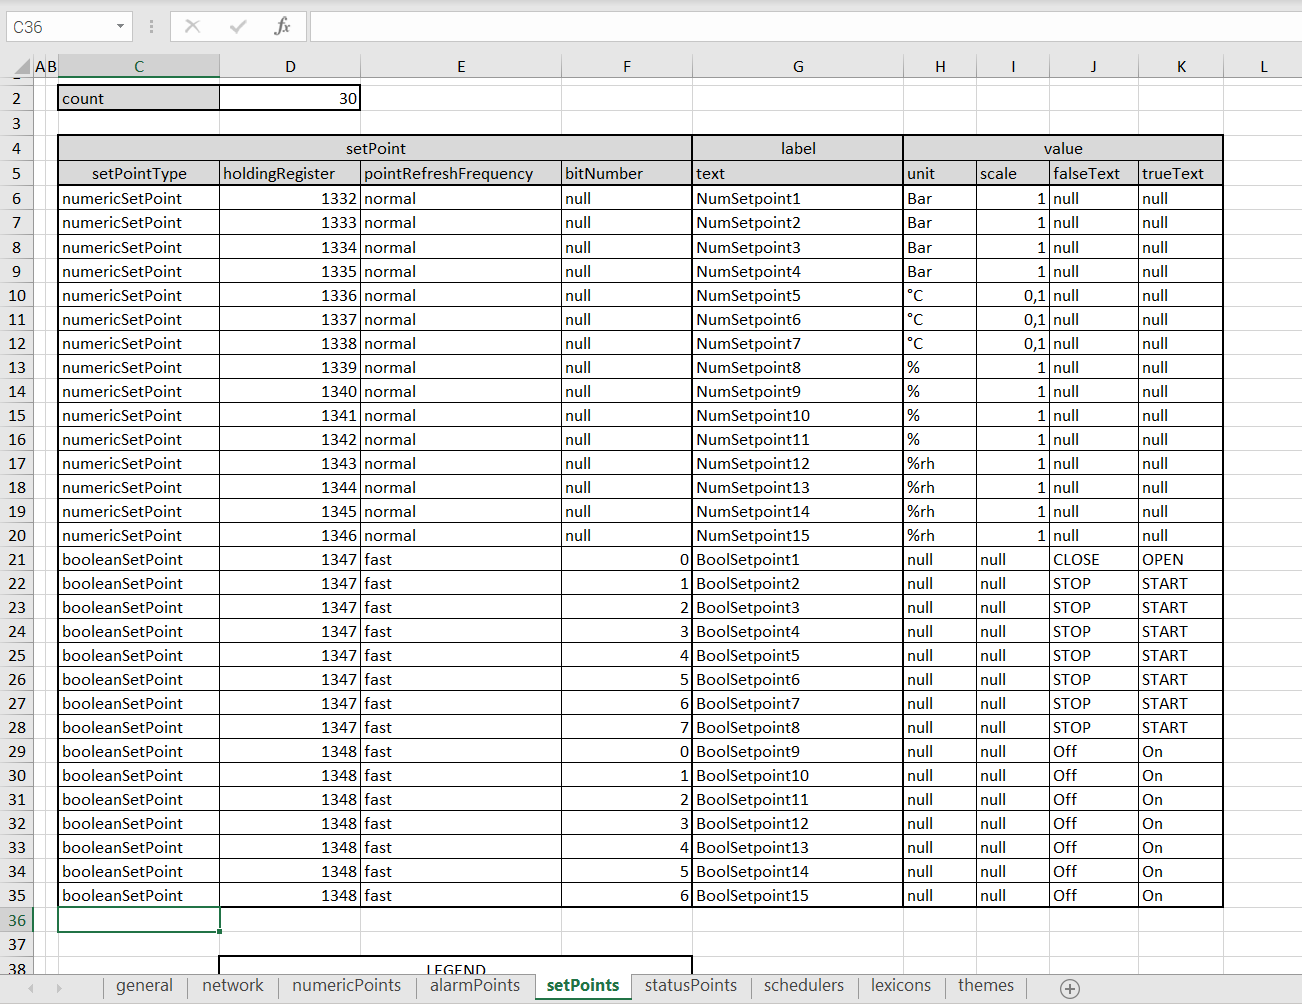
A setPoints sheet
The maximum number of all setpoints is 30, no matter what type of variables is used (numeric setpoint or Boolean setpoint). To set the number of displayed setpoints, fill in the "count" cell.
For numeric and Boolean setpoints, it is possible to set the following parameters:
-
setpointType: defines a type of component used for setpoints (numeric or Boolean);
-
Modbus holdingRegister: defines the address of the Modbus holding register used in the iSMA Tool application;.
-
pointRefreshFrequency: polling frequency selected from pre-defined values (fast, normal, slow);
-
label: text displayed on the main visualization page.
In order to use numeric setpoints, set the additional parameters:
-
Unit: unit displayed on the main visualization page;
-
Scale: scale of the Modbus holding register for correct reading via Modbus protocol.
For numeric setpoints, the bitNumber, falseText, and trueText cells have to be left with a null value.
In order to use Boolean setpoints, set the additional parameters:
-
bitNumber: defines a bit of the holding register responsible for each variable in a component;
-
falseText: text displayed for a false (0) value;
-
trueText: text displayed for a true (1) value.
Warning!
The maximum number of Boolean setpoints types is set to 16, and the maximum number of numeric setpoints is also set to 16.
statusPoints
A statusPoints sheet lists the status points displayed on the visualization page.
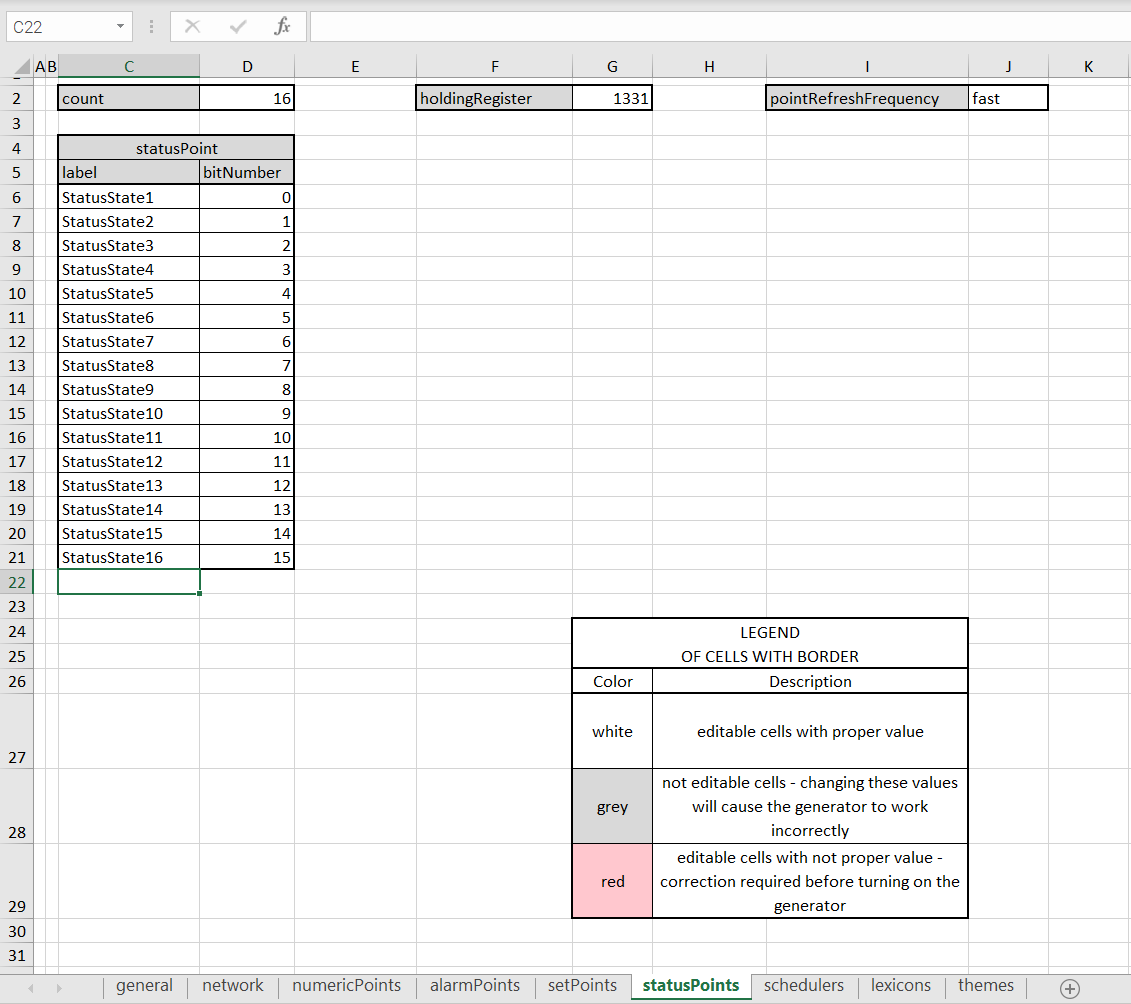
A statusPoints sheet
The maximum number of status points is set to 16. To set the number of visible displayed number status points, fill the "count" cell. All status points use 1 holding register. Polling frequency can be set for reading points (fast, normal, slow).
For each point, it is possible to set the following parameters:
-
label: text visible displayed on the main visualization page;
-
bitNumber: defines a bit of a holding register responsible for each variable in a component.
Schedulers
A schedulers sheet allows to configure schedules displayed in the visualization web server.
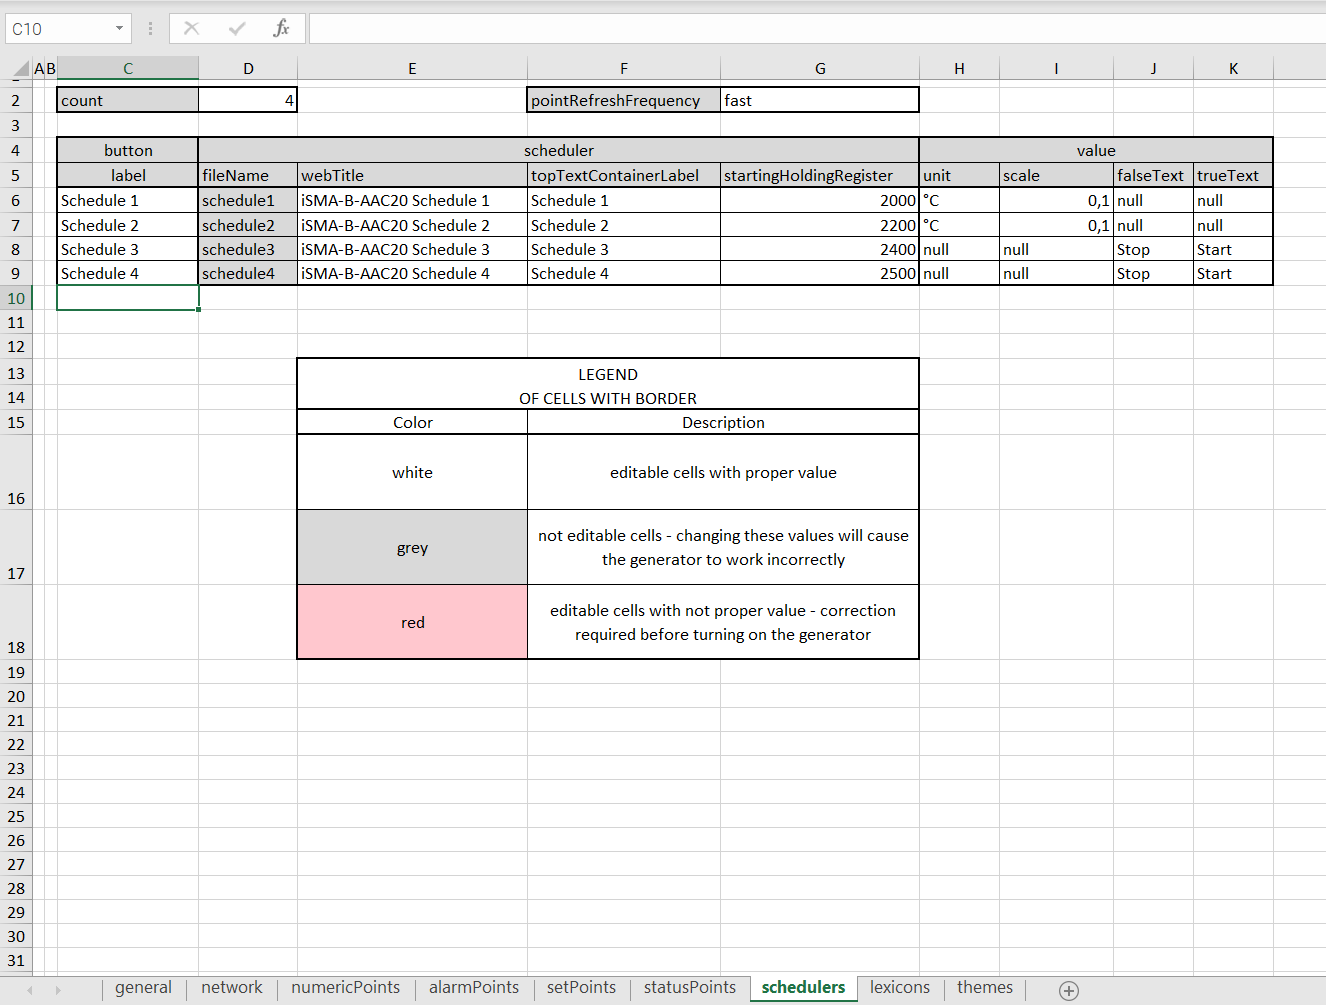
A schedulers sheet
It is possible to configure up to 4 schedules; in order to set the number of displayed schedules, fill in the "count" cell. Polling frequency can be set in the pointRefreshFrequecy field.
For each schedule, it is possible to set the following parameters:
-
label: sets a text displayed on a schedule's button on the main page;
-
webTitle: sets a text displayed on a tab in a browser;
-
topTextContainerLabel: sets a text displyes on top of a page of each schedule in the web server;
-
startingHoldingRegister: sets an address of a starting holding register for each schedule (accepts only decimal addresses in a range of 1000-2999);
For numeric schedules, set the additional parameters:
-
Unit: unit displayed on the main visualization page;
-
Scale: scale of the Modbus holding register for correct reading via Modbus protocol.
For numeric schedules, the falseText and trueText cells have to be left with a null value.
For Boolean schedules, set the additional parameters:
-
falseText: text displayed for a false (0) value;
-
trueText: text displayed for a true (1) value.
For Boolean schedules, the unit and scale cells have to be left with a null value.
Lexicons
A lexicons sheets allows to enter translations to display the web server in various language versions.
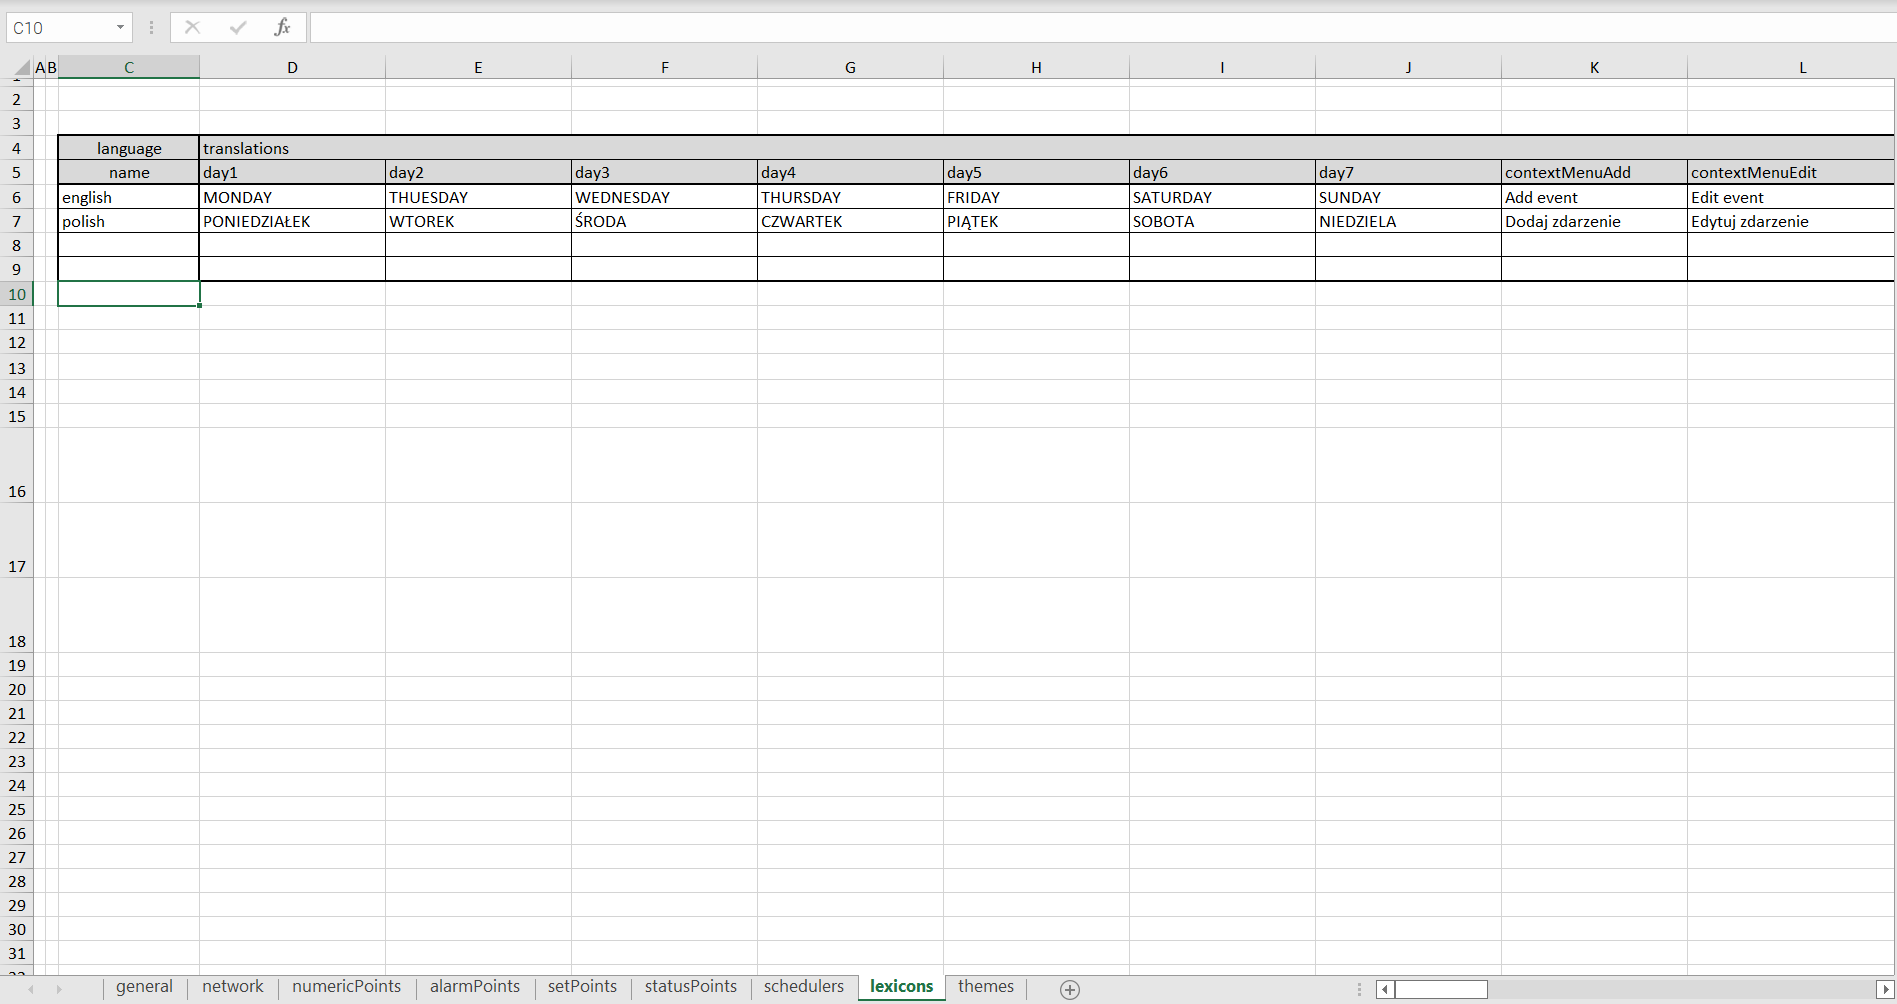
A lexicons sheet
The lexicons table allows to define a language of a translation in a first column. Following columns identify web server fields which names can be translated to different language. Each row contains translation to one language. It is possible to introduce unlimited number of languages and translations.
Note: All translated terms have to be put in one row, which refers to a language defined in the first column.
The language used in the web server is defined in the general tab.
Themes
A themes sheet allows to configure variants of the web server's appearance.
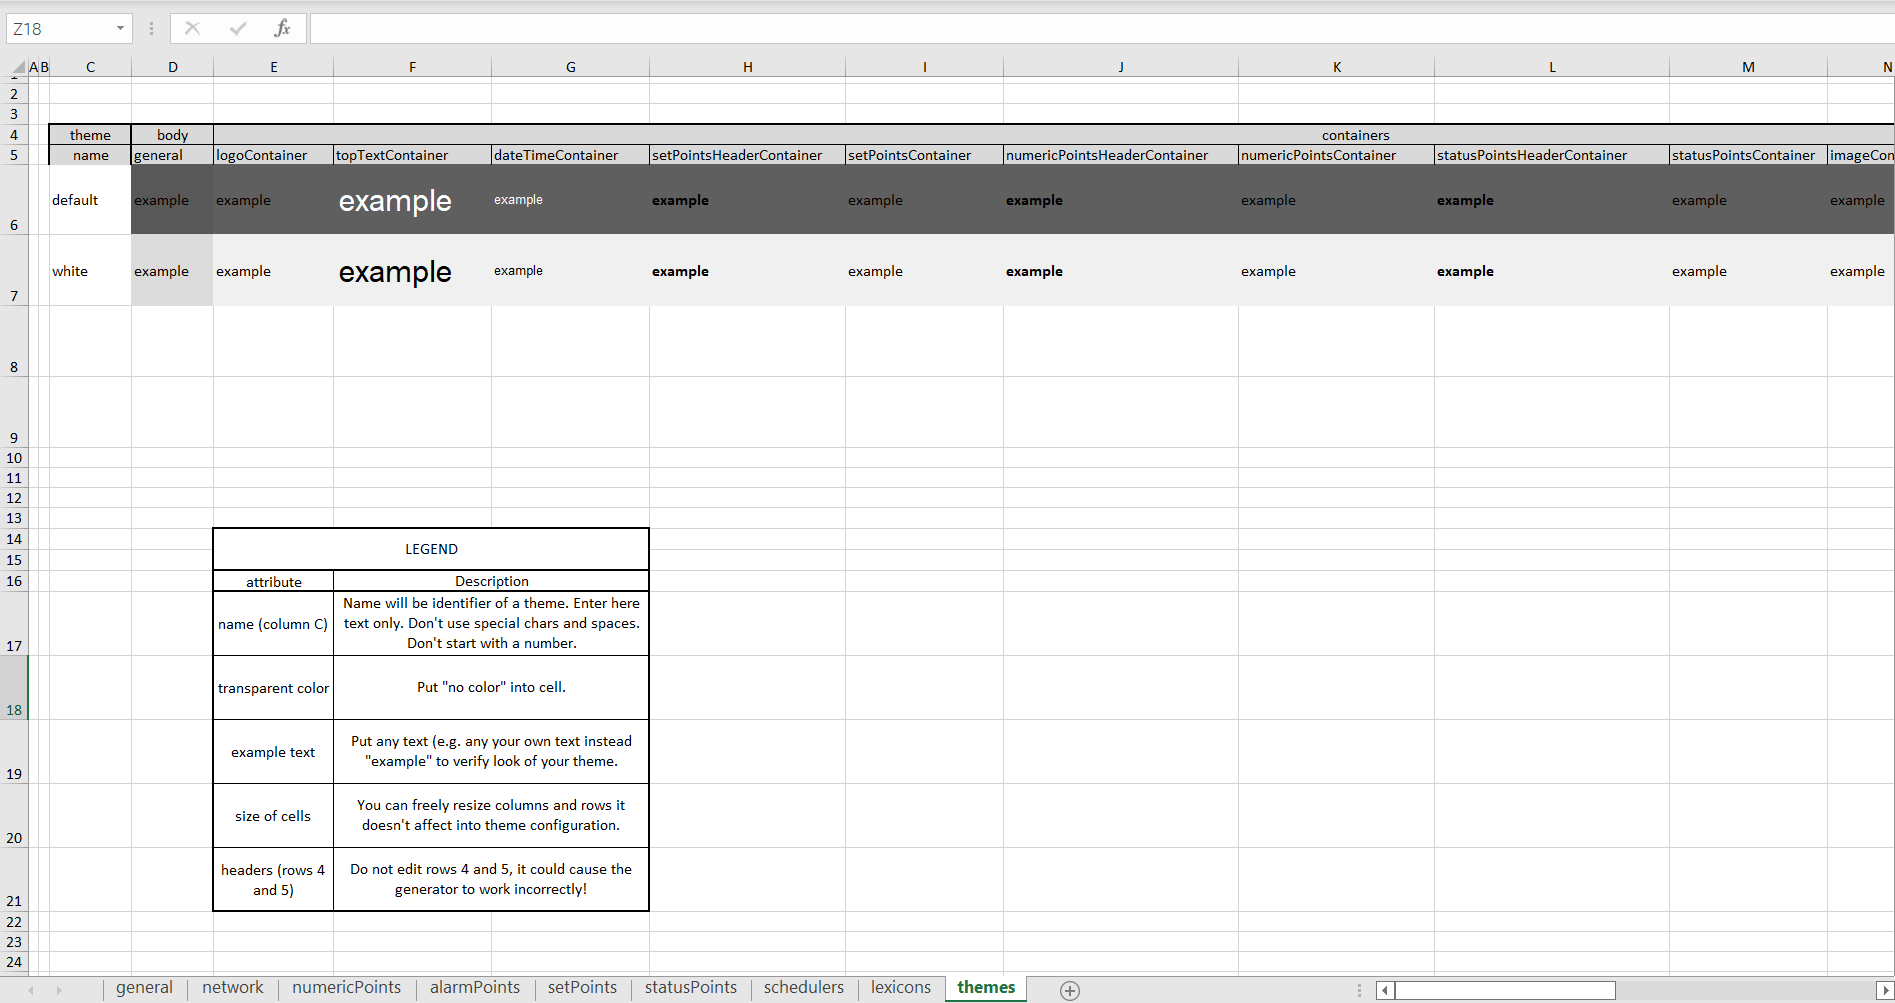
A themes sheet
The themes table allows to define the following parameters of the appearance of each component identified in the table's header:
-
background color;
-
font color;
-
font size;
-
font name;
-
font weight;
-
font style.
First columns defines names of themes. A theme of the web server is selected in the general tab.